Go back
Insight
December 18, 2025

Highlights
Nexus solved a real-world Maven Analytics challenge end-to-end by turning a raw CSV and a plain-English objective into a verifiable SQL query in a single run.
The case study shows how Nexus eliminates setup overhead by skipping dashboards, formulas, and tooling decisions and going straight from data to answer.
Results matched expected Golden Cross signals exactly, demonstrating how Nexus delivers fast, auditable analysis for everyday business workflows.
We wanted a clean, external test of Nexus, one that did not rely on a demo script or a handpicked dataset. Just a real analytics problem, solved under real conditions.
So we chose a public data analyst challenge from Maven Analytics called “Turning Bullish”. The drill is simple to explain, but tedious enough to do by hand that it quickly shows whether a tool actually helps or just adds another layer of work.
Maven Analytics Data Drills are hands-on, real-world data exercises where data practitioners work through practical business problems using Excel, SQL, Python, and Power BI. Solutions often involve building dashboards, running queries, or analyzing sales and financial trends using realistic datasets. The goal is to mirror real analytical work, not made up examples, and help users build skills through applied problem-solving.
The Turning Bullish challenge is straightforward: you download a CSV with five years of daily closing prices, calculate a 50-day and a 200-day moving average, and identify every “Golden Cross” date where the 50 day-average crosses above the 200-day average. Simple in concept. Potentially time-consuming in practice.
What We Did in Nexus
We did not build a dashboard. We did not model relationships. We did not write a single formula.
We imported the CSV into a MySQL database, connected it to Nexus, pasted the challenge description as the prompt, and hit run. That is it. Not even a minute of work, compared to the usual multi-step process of setting up tools, calculations and queries by hand.
Nexus skipped the busywork and went straight from “here’s the file and the question” to an answer you can verify.
This is the kind of workflow that sounds too good until you try it. Most tools are great once everything is already set up. The friction is always at the start: importing, configuring, and cleaning data, choosing a tool, then writing the first draft of the query, fixing edge cases, and validating output.
Nexus skipped the busywork and went straight from “here’s the file and the question” to an answer you can verify. What normally takes multiple tools, setup steps, and iterative fixes became a single interaction, showing how Nexus accelerates the kind of data analysis needed to solve real problems businesses repeat daily.
The Results Nexus Produced
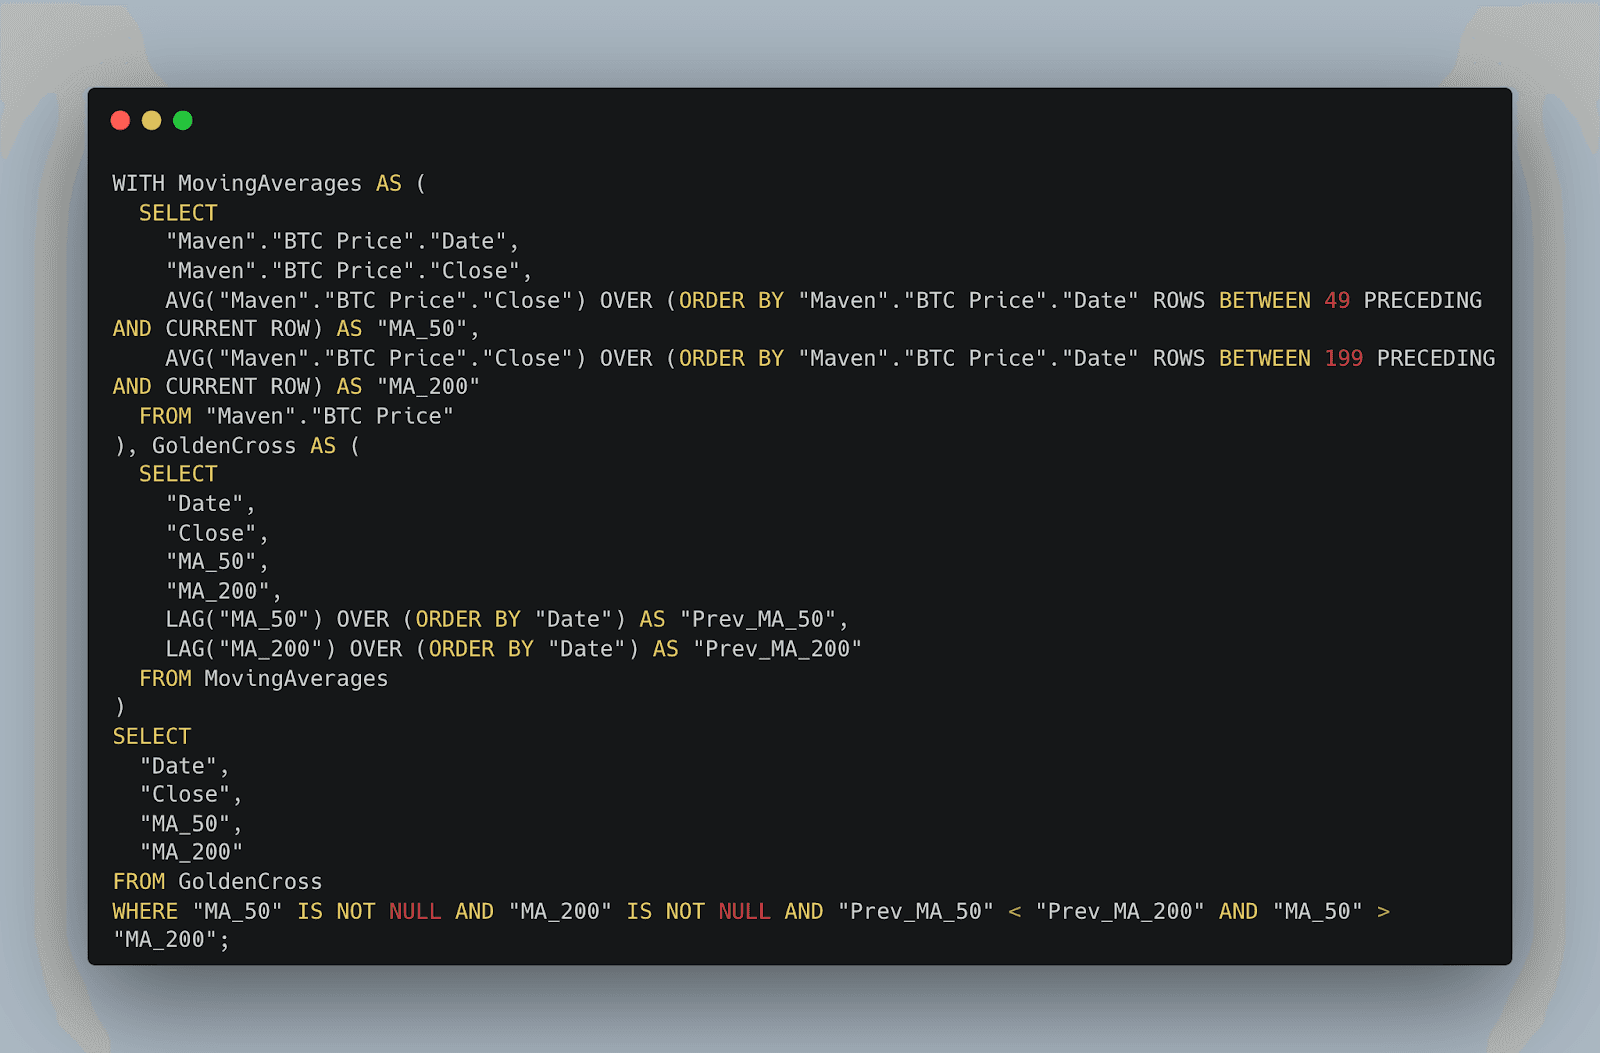
Nexus generated a query that does two things: it computes rolling average and detects crossovers by comparing today’s averages to yesterday’s.
Here is the exact SQL Nexus produced:
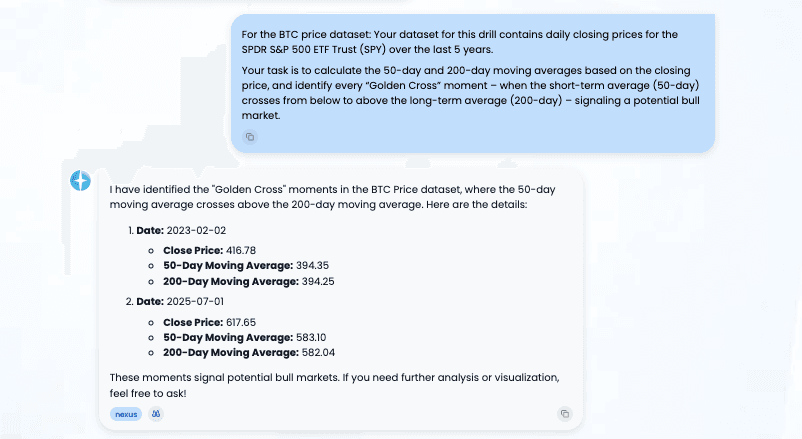
When run against the dataset, the query returned two Golden Cross moments:
Date: 2023-02-02
Close: 416.78
MA 50: 394.35
MA 200: 394.25
Date: 2025-07-01
Close: 617.65
MA 50: 583.10
MA 200: 582.04
Those dates line up with what the drill expects, and the most recent signal and close price match what others report for this exact drill and timeframe.
Why This Matters
A Golden Cross is not a complex idea. The value is in getting it right quickly, without handholding, and without quietly making assumptions you did not ask for.
In the official Maven solution content, the whole point is showing how much work it takes across different tools (Excel, Power BI, SQL, Python) to reach the same finish line. That effort is normal. In practice, you often spend more time setting up the path than answering the actual question.
What Nexus showed here is a different shape of workflow:
Start with a raw file and a plain English objective.
Get back a concrete, auditable query and final results.
Copy, rerun, tweak, or extend it immediately.
The Takeaway
This drill is a small, real-world problem on purpose, which is exactly why it works as a case study.
If Nexus can take a random CSV, understand an analytics objective, generate the right query pattern for rolling windows plus crossover detection, and match the expected outputs immediately, then the same flow scales to the day to day work people actually do: messy exports, ad hoc questions, repeated reporting requests, and constant follow ups.
Upload, ask, verify, move on.
Most data work does not fail because the analysis is hard. It fails because getting started is slow. Files need cleaning, tools need setup, and simple questions turn into multi-hour tasks.
This case study shows what happens when that setup disappears. A real-world dataset. A real analytics objective. A verifiable result, produced immediately.
If this is the kind of work your team does every day, Nexus is built for it. Upload your data, describe what you need, inspect the result, and move on.
Try Nexus with your own data at https://nexus.nukl.ai